
Emissions
Engine cleanliness and emission control devices
FAME esters are addressed with many benefits, such as acceptable ignition properties, good lubricity and no sulfur or aromatics. However, high viscosity of esters may affect injection performance and cold-start properties. Distillation range of esters is narrow and boiling point high, which may lead to deterioration of oil quality. FAME biodiesel may also contain impurities, e.g. triglycerides, glycerol, alcohols and ash-forming elements, such as Na, K, and P (Graboski et al. 1998, WWFC 2006). Practically all new diesel cars today and heavy duty vehicles in the future are equipped with a particulate filter, which reduces emissions effectively. Ash-forming elements (P, Ca, and Mg etc.) may lead to clogging of these exhaust after-treatment devices. Deposit formation in fuel injectors of engines is a phenomenon that shall be limited to a certain level in order to keep power output and low exhaust emissions constant over the entire life of a vehicle. For example, sodium (Na) is suspected to promote harmful internal deposits in fuel injectors. (Mikkonen 2011).
Power output, fuel consumption, and CO2
Volumetric heat content of FAME esters is lower compared to conventional diesel and thus volumetric fuel consumption higher and power output lower. Mass-based fuel consumption is compensated to some extent with higher density of FAME esters. Typically, fuel economy suffers a 1–2% loss with a 20% biodiesel blend, owing to the lower volumetric heating value of the biodiesel (The U.S. Environmental Protection Agency, EPA 2002).
Biodiesel fuel, whether in neat form or in blends, generally has a beneficial effect on engine emissions – an effect that can vary with feedstock, engine technology, and the properties of the diesel fuel into which the biodiesel is blended. A large number of test reports that document the effects of biodiesel on emissions have been generated. The U.S. Environmental Protection Agency (EPA) undertook a thorough survey and analysis of the emissions effects of biodiesel using publicly available data and information (EPA 2002). They used statistical means to develop correlations of the blend levels of biodiesel (blended with conventional diesel fuel) and the levels of both regulated and unregulated emissions. The overall results of their analyses are presented in Figure 9 below where the average emission impacts of soybean-based biodiesel are shown as a function of blend level. It should be noted that 98% of the data analyzed in this study was collected on 1997 or earlier model-year engines. In studies subsequent to EPA’s there have been differences reported between the older-technology engines and the newer technologies. EPA drew no conclusions related to light duty diesel engines or non-road vehicles. (IEA-AMF Task 34-1: McGill et al. 2008).
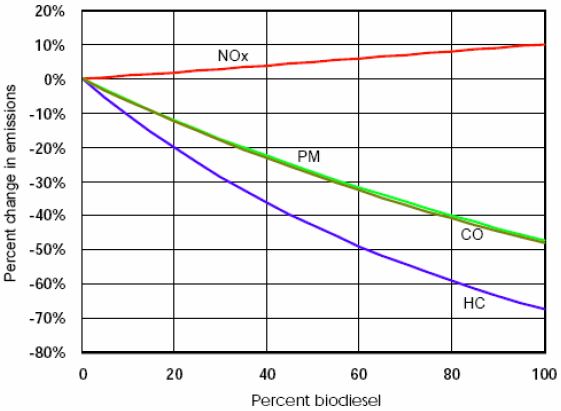
Figure 9. Average emission impacts of biodiesel for heavy-duty highway vehicles (EPA 2002).
Noteworthy in the figure are the dramatic reductions in hydrocarbon (HC), carbon monoxide (CO), and particulate matter (PM) along with the modest increase in nitrogen oxides (NOx) emissions. These trends are commonly attributed to the oxygen content in biodiesel, giving rise to better oxidation of the HC, CO, and PM, as well as, possibly, adding to the rise in NOx. A common blend of biodiesel is one with 20% biodiesel blended into number 2 petro-diesel. A summary of the results for that common blend level is shown below as average emissions impacts from a 20 vol-% biodiesel (soybean-based) added to petro-diesel (EPA 2002):
- NOx: +2.0%
- PM: -10.1%
- HC: -21.1%
- CO: -11.0%
In a more recent study by Murtonen et al. (2009) with several buses and engines, in most cases RME reduced all other regulated emissions except NOx. The PM emissions reduced by 17 to 51%%, except for one engine that showed an increased PM emissions with RME. At the same time the NOx emissions increased by 6-14% with RME. In the IEA-AMF Task 38, Sato et al. (2012) and Mizushima and Takada (2014) observed increase in NOx emissions with FAME, as well.
Capability of FAME esters to reduce the PM emission is believed to be due to the presence of oxygen in FAME (McCormick et al. 2001, Durbin et al. 2002, Grimaldi et al. 2001, 2002). FAME reduces the soot portion of PM, but increases soluble organic fraction (SOF). FAME results in so called "wet" particles and in some cases, this can lead to higher PM emissions with FAME than with diesel fuel, e.g. at partial loads or at cold temperatures (Akasa et al. 1997, IEA-AMF Task 13 McGill et al. 2003).
An oxidation catalyst removes SOF efficiently, and thus a combination of FAME and oxidation catalyst can result in a substantial benefit in PM emission. Particles contain also sulfates, nitrates, metals and trace elements. The role of sulfates is diminishing with today's low-sulfur fuels. (IEA-AMF Task 13: McGill et al. 2003).
In the IEA-AMF Task 37, Environment Canada found for the 2007 platform buses that biodiesel yielded lower PM emissions than diesel, while for the EPA 1998 platform not much effect was seen, and for the 2010 buses emission level was too low for conclusions. The lowest particle number emission rates were observed with the B20 Canola. At VTT, switching from conventional diesel fuel to FAME reduced PM emissions up to 50%, but NOx emissions slightly increased. (Nylund and Koponen Eds. 2012).
In the IEA-AMF Task 38, Sato et al. (2012) studied the engine or vehicle operating with waste edible oilâ€based BDF (FAME). The NOx emissions increased accordance with an increase of BDF rate. Also in Phase 2 of this study, the NOx emissions increased significantly with the increased mixing ratio of FAME (Mizushima,and Takada 2014).
In the IEA-AMF Task 45, Using FAME as a diesel substitute enormously decreased the formation of partly burned combustion products and soot in raw exhaust, though, NOx emissions was increased. With ECU settings adapted for FAME, NOx emissions reduced to the same level as with diesel fuel, and fuel consumption decreased compared to the standard ECU operation.
The effect of feedstock
EPA’s analysis revealed that biodiesel emission impacts varied depending on the biodiesel feedstock (soybean, rapeseed, or animal fats) and on the base fuel to which the biodiesel was blended. We saw in the fuel properties section, how the selection of biodiesel feedstock can affect many properties of the final biodiesel fuel. Not surprisingly then, the selection of feedstock also affects emissions. Figures 10 and 11 below highlight those differences in NOx and PM emissions, respectively. Notice the large difference, for example, in NOx emissions between the soybean-based biodiesel and the animal-based biodiesel. The difference is also striking with PM emissions. (IEA-AMF Task 34-1 McGill et al. 2008).
Task 37, Jatropha methyl ester(JME) delivered better results with respect to NOx, carbonyl emissions and mutagenicity than RME. On the other hand, JME had higher CO and THC emissions, and higher numbers of particulates smaller than 300 nm. Emissions for JME were comparable to those of palm oil derived methyl ester and, and can be explained by less double bonds and the shorter chain length. CFPP for JME is only 0 °C, and therefore this fuel can only be used in warm climate. (Nylund and Koponen Eds. 2012).
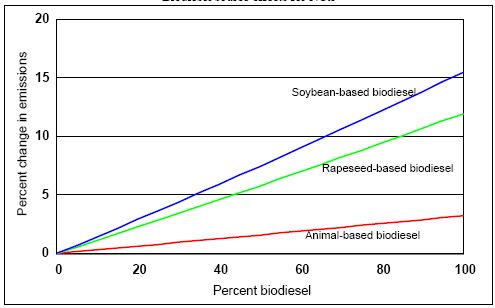
Figure 10. Changes in NOx emissions with biodiesel feedstock selection (EPA 2002).
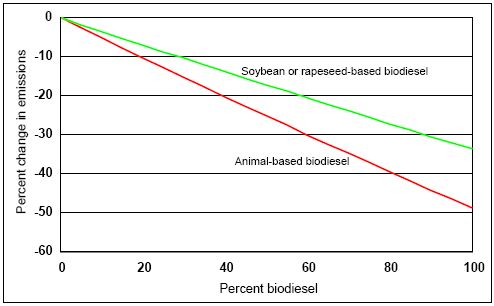
Figure 11. Changes in PM emissions with biodiesel feedstock selection (EPA 2002).
The reason for increase in NOx emission with FAME is not clear. The role of density, high distillation area, oxygen content and double bonds has been considered as reasons (McCormick et al. 2001). Ignition delay with FAME can be shorter than with diesel, if cetane number of diesel fuel is poor, but vice versa when FAME is compared to high-cetane diesel fuel. According to Graboski et al. (1998), the effect of low soot emission on flame temperature may affect NOx emission with FAME. In addition, possible changes caused by FAME’s physical properties in e.g. spray behavior, ignition delay and injection timing may cause unexpected effects on emissions. (IEA-AMF Task 34-1: McGill et al. 2008).
Since biodiesel fuel blends appear to increase NOx emissions, a storm of controversy about the issue has arisen. Some policy-makers are worried about the implications of greater levels of NOx while others argue that the other emissions benefits of biodiesel outweigh the small increases in NOx emissions. Considerable R&D on the NOx question already exists, but the body of knowledge is growing at a great pace because of this controversy. Here, we examine some of the important findings thus far.
Several NOx-affecting factors have been examined, including:
- Engine load
- Adjusted injection timing
- Cetane additives
- Variation with biodiesel composition
- Effect of degree of unsaturation of biodiesel fuel
Examinations of the differences in emissions performance of biodiesel fuels in new and older engines have been done as well as comparisons of results between engine versus vehicle emissions tests. IEA-AMF Task 13 (McGill et al. 2003) reported of engine mapping tests with engines. NOx emission with rape seed, soy bean and used vegetable oil methyl esters were higher than that with the baseline fuel for most engine conditions, except for high-speed and some medium-load and low-load conditions. In all engine conditions, the lowest NOx emissions were achieved with reformulated diesel fuel (low-aromatics and low-sulfur fuel).
Retarding the injection timing can reduce the NOx emissions, but the reduction comes at the expense of higher fuel consumption and greater PM emissions, which at the normal injection timing are greatly reduced. This is illustrated in Figure 12 below. (Graboski and McCormick 1998)
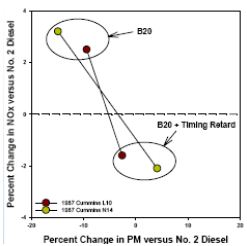
Figure 12. Effect of retarding injection on NOx and PM (McCormick 2005).
McCormick et al. (2002) studied the use of cetane improvers for reducing the increased NOx effect in FAME 20% blends of soy-based and yellow-grease-based biodiesel in certification diesel fuel and with a 1991-vintage diesel engine. Cetane improver additives were di-tert-butyl-peroxide (DTBP) and 2-ethyl-hexyl-nitrate (EHN). The two biodiesel fuels vary greatly in properties such as degree of saturation, cetane number, iodine number, and fuel density. Figure 13 below shows the improvement in NOx emissions with different blending levels of DTBP and EHN in soy-based B20.
The results are shown in comparison with the NOx emissions from the certification diesel fuel alone. In the case of the soy biodiesel, the cetane number was increased from 48 to 60 with 1% of DTBP.(McCormick et al 2002, IEA-AMF Task 34-1 McGill et al. 2008).
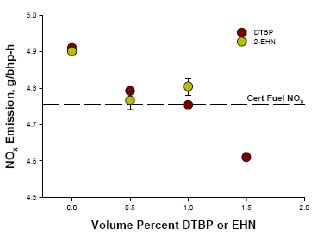
Figure 13. Improvement in NOx emissions with addition of cetane improver additive (McCormick 2005).
Similar reductions in NOx emissions were achieved with the cetane additives used in the yellow-grease-based biodiesel even though the improvement in cetane numbers for the fuel was not as great. The test engine in these tests was of a fairly old technology, and that might have influenced the results. McCormick et al. (2005) found “no measurable effect on NOx emissions” with the cetane additive on the newer engines. These engines had a more highly retarded injection timing (to reduce engine-out NOx) and were less sensitive to the cetane improvement from the additive. The cetane improver EHN was mixed with B20 fuel and tested with heavy-duty engines that met 2004 U.S. emissions standards (newer technology engines, Cummins ISB and a Detroit Diesel Series 60; EHN concentration 4,000 ppm and 5,000 ppm). The results with a Detroit Diesel 60 (DDS 60) engine are shown in Figure 14 below. (IEA-AMF Task 34-1: McGill et al. 2008).
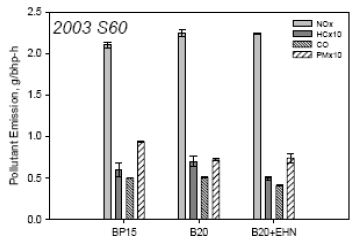
Figure 14. Emissions results for soy B20 with 5,000 ppm EHN in the Detroit Diesel Series 60 engine (DDS60). BP15 = ultra-low sulfur (below 15 ppm) diesel fuel (McCormick et al. 2005).
We saw earlier how the selection of biodiesel feedstock could have some influence on NOx emissions. McCormick elaborated more on that issue in the 2005 presentation to a California Air Resources Board Biodiesel Workgroup (McCormick 2005). Figure 15 below shows the NOx emissions variation with biodiesel feedstock. Fuels were tested in a 1991 Detroit Diesel Series 60 engine on an engine dynamometer. The tests were with straight 100% FAME biodiesel fuels (not blended with diesel fuel) and compared against low-sulfur diesel fuel (less than 15 ppm sulfur) The data were reported by McCormick et al. (2001). NOx results were plotted against the iodine number of the various biodiesel fuels, and it is clear that the NOx emissions correlate well with the iodine number and the iodine number correlates with degree of unsaturation of fatty acids. For example, a highly unsaturated fatty acid, like soybean oil, will produce biodiesel fuel with a high iodine number and higher NOx emissions. Conversely, a highly saturated feedstock, like beef tallow, will produce a biodiesel fuel with a low iodine number and lower NOx emissions. In fact, we have seen many correlations of this type. Highly saturated feedstocks will produce biodiesel fuels with higher cetane numbers, higher cloud point, and lower NOx emissions, when compared to biodiesel fuels made from less saturated feedstocks.
Typically, all types of diesel fuel with higher cetane numbers will reduce NOx emissions when compared to lower cetane number fuels. (IEA-AMF Task 34-1: McGill et al. 2008).
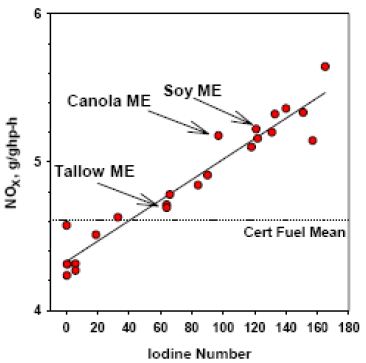
Figure 15. NOx emissions as a function of biodiesel iodine number (McCormick 2005).
The biodiesel NOx effect has become even more confusing. First, tests with newer engines were beginning to show NOx results different from those from older engines. In fact, on average the newer engines were showing an even higher increase in NOx emissions on engine dynamometer tests. This is illustrated dramatically in Figure 16 below (McCormick 2005). The differences are most dramatic at the 100% FAME level. (IEA-AMF Task 34-1: McGill et al. 2008).
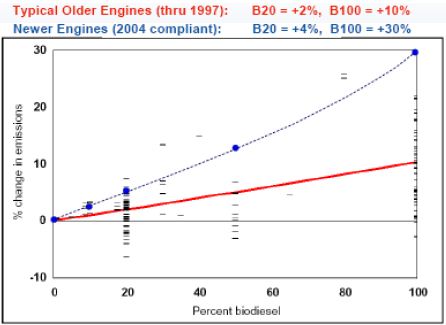
Figure 16. Biodiesel effects on NOx emissions - Newer versus older engines - Engine test data (McCormick 2005).
Then, as more researchers began to use vehicle dynamometer tests of biodiesel fuels, even another dimension in the NOx variation phenomenon was added. In this case, vehicle-based tests are often, but not always, showing NOx reductions with biodiesel rather than NOx increases. We must emphasize, however, that there is still great inconsistency between tests, both in engine tests and in vehicle tests. Because of these uncertainties, the US Department of Energy (DOE) commissioned the National Renewable Energy Laboratory (NREL) to “determine if testing entire vehicles on heavy-duty chassis dynamometer provides a better, more realistic measurement of the impact of B20 on regulated pollutant emissions.” (McCormick et al. 2006) NREL reviewed recently published engine testing studies (including the extensive review by the US EPA) and several recently published vehicle testing studies. They also reviewed three vehicle studies using portable emissions measurement systems, all of which showed no substantial NOx increase. NREL also did vehicle testing of three transit buses, two school buses, two US class eight trucks, and one motor coach. Four of these met the 1998 US emissions requirement of 4 g/bhp-h NOx, and four met the 2004 limit of 2.5 g/bhp-h NOx + HC.(IEA-AMF Task 34-1: McGill et al. 2008).
Based on all the studies they reviewed, plus the new data generated in their own tests they concluded that:
- “There does not appear to be a discrepancy between engine and chassis testing studies for the effect of B20 on NOx emissions.”
- “Individual engines may show NOx increasing or decreasing, but on average there appears to be no effect, or at most a very small effect on the order of ± 0.5%.”
- “The small apparent increase in NOx reported for engine-testing results in EPA’s 2002 review occurred because the dataset was not adequately representative of on-highway engines.”
The EPA did a comprehensive, statistical analysis of pre-existing data and reports on the effects of biodiesel fuel on emissions (EPA, 2002). A large number of results from different researchers were included in the analysis. However, the data on toxic emissions were much fewer than for the regulated emissions. Therefore, EPA’s conclusions are to be taken as “preliminary.” They found data for 11 of the Mobile Source Air Toxics: formaldehyde, acetaldehyde, acrolein, benzene, 1,3-butadiene, ethylbenzene, n-hexane, naphthalene, styrene, toluene and xylene. The aggregate results for toxics and total hydrocarbons are shown plotted against the biodiesel blend level in Figure 17 below.
Note: there is a wealth of information on Mobile Source Air Toxics at http://www.epa.gov/otaq/toxics.htm. This includes discussions on Basic Information, Health effects & Risk, Emissions, Monitoring & Exposure, Regulations and Related EPA Programs
Clearly, biodiesel blends reduce levels of air toxics. In these data, biodiesel was blended with conventional diesel fuel (Diesel 1 or 2). Examining the properties of the average biodiesel with the average conventional diesel fuel will help to understand why FAME biodiesel reduces air toxic emissions. Two important properties to be noted are the aromatics and sulfur contents. Aromatics are known to contribute to toxic emissions, and sulfur also causes emission problems. Biodiesel has no aromatics and the sulfur content was much smaller than in conventional diesel at the time of studies. Being that this EPA studied dealt with data that pre-existed prior to the publication date in 2002, ultra-low sulfur diesel (ULSD) fuel did not exist in abundance in the U.S. So the data included in the EPA analysis did not represent tests with ULSD, with reduced levels of aromatics and sulfur. Therefore, the benefit gained in toxic emissions with biodiesel ester blends should be expected to be less than those represented in Figure 17 below. (IEA-AMF Task 34-1: McGill et al. 2008).
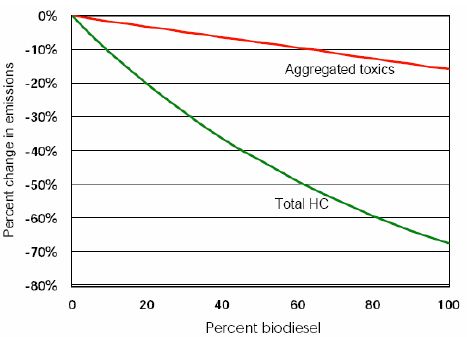
Figure 17. Reductions in toxic emissions with increasing blend levels of biodiesel (EPA 2002).
Krahl et al. (2001) reported that aldehyde emissions increased with FAME biodiesel, but some studies report on reductions of aldehyde emissions with FAME (e.g. Sharp et al. 2000). Typically oxygen containing fuels tend to increase aldehyde emissions, but results may also depend on the cetane number of fuels used for comparison. In addition, engines may behave differently. For example, Murtonen et al. (2009) observed lower formaldehyde emission for FAME than for diesel with one engine, but opposite result was observed with another engine.
PAH emissions are generally reduced when biodiesel esters are compared with conventional diesel fuel. In addition, mutagenic effect with Ames test tends to be lower for FAME than for conventional diesel fuel. This is believed to be due to differences in PAH content of exhaust gases and thus only slight or no benefit with FAME is gained when compared to diesel fuel with very low aromatics content (IEA-AMF Annex 13 McGill et al. 2003, Bünger et al. 2007, Murtonen et al. 2009).
Particle number size distributions with FAME biodiesel depend on engine, after-treatment, load and measurement conditions. Generally, number of particles in the accumulation, “soot” mode (around 0.1 μm), is lower for FAME biodiesel than for conventional diesel. However, FAME may increase nuclei mode particles (below 56 nm), especially at cold temperatures and when compared to low-aromatic and low-sulfur diesel fuel (Aakko et al. 2002, 2003, Tsolakis 2006).
A number of studies have been carried out examining the impact of biodiesel blend ratio on vehicle performance and emissions at cold temperatures. In the study with turbocharged direct injection (TDI) and indirect injection (IDI) diesel cars, the differences between standard diesel fuel and a blend with 30% RME showed quite similar trends at normal and at -7 °C test temperatures (IEA-AMF Task 13 Aakko and Nylund 2003).
Bannister et al. (2009) studied the effects of adding RME on the fuel consumption and tailpipe emissions of a vehicle equipped with a 2.0 liter common rail diesel engine, tested on a chassis dynamometer at ambient temperatures of 25°C, 10°C, and -5 °C. This study found that under low temperature ambient conditions, increasing blend ratios had a significant detrimental effect on vehicle PM emissions reversing the benefits observed at higher ambient temperatures. Blend ratio was found to have minimal impact on hydrocarbon emissions regardless of ambient temperature while carbon monoxide and NOx emissions were found to increase by up to 20% and 5.5%, respectively. Fuel consumption rose by 5% for a B50 blend - a larger than expected increase when considering differences in calorific values alone.
Health and air quality effects
Biodiesel esters can reduce tailpipe emissions of most regulated pollutants, with the exception of NOx. NOx is either slightly increased or as observed in more recent analyses, possibly unchanged. In addition, biodiesel esters will reduce levels of unregulated, toxic emissions. The question now is whether those emission benefits will translate into improvements in ambient air quality and in health risks associated with air quality. To address these questions NREL in the U.S. contracted with the ENVIRON International Corporation to research the issues and produce a series of reports on their findings. They published five reports and a summary report, all in 2003, titled “Impact of Biodiesel Fuels on Air Quality and Human Health” (NREL web site – www.nrel.gov). A Summary Report was published by Morris et al. (2003).
In order to develop a profile of tailpipe emissions data for use in the models, biodiesel test data were averaged for cases of B100 and B20. Compared to a standard diesel fuel at that time (up to 500 ppm sulfur), the average emissions reductions or increase for these cases are shown in Table 4 below.(IEA-AMF Task 34-1: McGill et al. 2008).
Table 5. Average changes in emissions for B20 and B100 compared to standard diesel fuel (Morris et al. 2003).
|
Biodiesel ester |
NOx |
PM |
CO |
VOC |
SO2 |
Toxicity |
|
B20 |
+2.4% |
-8.9% |
-13.1% |
-17.9% |
-20.0% |
-5.0% |
|
B100 |
+13.2% |
-55.3% |
-42.7% |
-62.0% |
-100.0% |
-20.0% |
They developed three hypothetical scenarios: a standard diesel base case, a 100% penetration of B20 in the heavy-duty fleet, and a 50% penetration of B20 in the heavy-duty fleet. Then, these scenarios were used in the ambient air quality models. Results were as follows:
Ozone (O3): The maximum projected increase for ozone resulting from either the 100% or 50% penetration of B20 in both the Southern California and the Eastern U.S. corridor was 0.26 ppb. Therefore, the conclusion was that the use of biodiesel is projected to have no measurable adverse impact on the 1- hour or 8-hour ozone attainment in the studied areas.
Carbon Monoxide (CO): The use of biodiesel was projected to reduce CO concentrations in the Las Vegas Valley, but these reductions would be extremely small, from 0.01 to 0.03 ppm, or less than 0.2%.
Particulate Matter (PM): The Southern California region was chosen for this scenario analysis because it is in nonattainment for PM10 and because ammonium nitrate is a major component of PM in that area and NOx is a precursor for ammonium nitrate. The effects of biodiesel were assessed for particulate sulfate, nitrate, ammonium, elemental carbon, organic carbon, other fine particulate, coarse matter, total PM10 mass, total PM2.5 mass, and exposure to PM10 and PM2.5. The researchers concluded that the maximum changes in PM10 and PM2.5 are extremely small. The largest effect was for particulate nitrate, which produced both increases and decreases due to the B20 fuel. The decreases occurred in the densely populated portions of the South Coast Air Basin (SoCab), while the increases occurred in the eastern portion of the region, in the desert. When compared to the case using standard diesel fuel alone, the 100% B20 scenario was projected to reduce the exposure to annual and 24-hour exceedances of the PM10 standard by 4% and 7%, respectively
PM Emissions Mass and Toxicity: It was projected that the use of B20 in the heavy-duty fleet would reduce the per million risk of premature death due to exposure to air toxics in the SoCab (South Coast Air Basin) area by 2% and 5% respectively for the 50% and 100% B20 penetration scenarios. (IEA-AMF Task 34-1: McGill et al. 2008).